

Scalable Vector Graphics, or SVG, is a markup language used for describing two-dimensional vector graphics. SVG images are made up of mathematical equations that can be scaled infinitely without losing quality. SVG is a versatile and popular format for creating graphics on the web because it allows designers to create graphics that are visually rich, interactive, and accessible
The idea behind SVG was to create a standard format for vector graphics on the web, similar to how JPEG and PNG had become standards for bitmap graphics. SVG was designed to be an open, platform-independent format that could be used across different web browsers and operating systems.
SVG Elements
SVG graphics are created using a wide range of elements that are specifically designed for constructing, drawing, and laying out vector images. These elements include shapes like rectangles, circles, and lines, as well as more complex elements like paths, curves, and gradients.
<div>
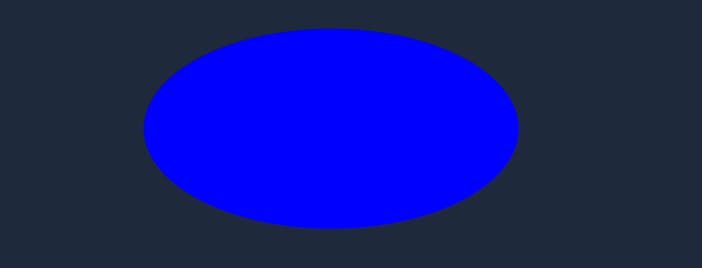
<svg width="400" height="300">
<ellipse cx="200" cy="150" rx="150" ry="80" fill="blue"/>
</svg>
</div>
Using these elements, we can create complex diagrams, charts, and illustrations with precision and accuracy. We can adjust the size, position, and color of each element to create the desired effect and can use animations and interactivity to make the graphics more engaging and dynamic.
Examples of SVG
SVG can be used to create a wide range of graphics on the web.
Iconography: SVG is widely used for iconography in web design. Icons created in SVG format are crisp and clean and can be easily scaled up or down without losing quality. They can also be styled and animated using CSS.
   <svg xmlns="http://www.w3.org/2000/svg" viewBox="0 0 24 24" width="200" height="200">
          <path d="M12 22c-5.5 0-10-4.5-10-10S6.5 2 12 2s10 4.5 10 10-4.5 10-10 10zm0-18c-4.4 0-8 3.6-8 8s3.6 8 8 8 8-3.6 8-8-3.6-8-8-8z"/>
          <path d="M14.7 8.3c-.4-.4-1-.4-1.4 0l-2.3 2.3-2.3-2.3c-.4-.4-1-.4-1.4 0s-.4 1 0 1.4l2.3 2.3-2.3 2.3c-.4.4-.4 1 0 1.4.2.2.5.3.7.3s.5-.1.7-.3l2.3-2.3 2.3 2.3c.2.2.5.3.7.3s.5-.1.7-.3c.4-.4.4-1 0-1.4l-2.3-2.3 2.3-2.3c.4-.4.4-1 0-1.4z"/>
   </svg>
This code generates a cross icon.For creating iconography using SVG, here are some helpful tips.
Keep it Simple: Avoid using too many details or complex shapes, as this can make the icon difficult to recognize when scaled down to a small size.
Use Vector Shapes: SVG is a vector-based format, which means that icons can be created using shapes such as rectangles, circles, and polygons.
Use Minimal Colors: Keep the number of colors used in the icon to a minimum, typically no more than two or three.
Use Consistent Design: Use a consistent design style and size for all icons to ensure that they look cohesive and work well together.
Data visualizations: SVG can be used to create interactive and animated data visualizations, such as charts and graphs.
  <svg xmlns="http://www.w3.org/2000/svg" viewBox="0 0 200 100">
    <rect x="10" y="20" width="10" height="30" fill="#3f51b5" />
    <rect x="20" y="30" width="10" height="20" fill="#e91e63" />
    <rect x="30" y="40" width="10" height="10" fill= "#ffc107" />
  </svg>
Logos and Branding: SVG is an excellent format for creating logos and branding assets for web and digital media. SVG logos can be easily resized and customized, making them highly versatile for use across various platforms and devices.
Maps: SVG maps can be customized and interactive, allowing users to zoom in and out, click on locations, and more. Here are some ways to create maps using SVG.
Use a Map Library: You can use javascript libraries to create SVG-based maps, such as Leaflet, Mapbox, and D3.js. These libraries provide a wide range of customization options, making it easy to create professional-looking maps.
Use GeoJSON: GeoJSON is a format for encoding geographic data structures. It can be used to create maps in SVG format. GeoJSON data can be easily imported into SVG maps using JavaScript libraries such as D3.js.
Animations: SVG animations can be used to create engaging and interactive graphics, such as loading animations or hover effects. SVG animations can be created using CSS or JavaScript and are highly scalable, making them ideal for use in responsive web design.
Use CSS Animations: One of the easiest ways to create animations using SVG is to use CSS animations. CSS animations allow you to animate SVG elements using keyframes, easing functions, and more.
Use JavaScript: If you need more control over your SVG animations, you can use JavaScript. JavaScript libraries such as GreenSock Animation Platform (GSAP) and
Snap.svgmakes it easy to create complex SVG animations.
Advantages
There are several advantages to using SVG for web graphics:
Scalability: As mentioned, SVG images can be scaled infinitely without losing quality. This means that designers can create graphics that look great on any device, from a tiny smartphone screen to a large desktop monitor.
Accessibility: SVG images can be read and interpreted by screen readers and other assistive technologies, making them more accessible to people with disabilities.
Interactivity: SVG images can be made interactive with JavaScript and other web technologies. This allows designers to create engaging and dynamic graphics that respond to user input.
Small file size: SVG files are typically much smaller than bitmap images, which can help reduce page load times and improve website performance.
SEO-friendly: Because SVG images are text-based, they can be indexed by search engines, which can improve a website's search engine rankings.
Disadvantages
Apart from the advantages SVG also has some disadvantages, those are:
Limited Support: Although modern web browsers have good support for SVG, older browsers may not support it fully. This can result in compatibility issues for some users.
Large File Sizes: SVG files can be larger in size than other web graphic formats like PNG or JPEG, which can result in slower loading times for web pages.
Complexity: SVG files can be more complex to create and edit than other web graphic formats, which can make them more difficult to work with for some users.
Limited Interactivity: While SVG files can include some interactivity, such as hover effects or clickable buttons, they are not as interactive as other web graphic formats like HTML, CSS, and JavaScript.
Limited Animation: SVG animations are defined using declarative markup, which means that the animation is pre-defined and cannot be modified on the fly. This is the reason it doesn't support dynamic animations.
Resources
SVG path - https://www.youtube.com/watch?v=k6TWzfLGAKo
Website to generate a path - https://embed.plnkr.co/plunk/KRqEkhvdBS4t0oAC
Website to generate polygons - https://weareoutman.github.io/rounded-polygon/
SVG path editor - https://yqnn.github.io/svg-path-editor/
SVG viewer - https://www.svgviewer.dev/s/402397/debug-script
Conclusion
For making web graphics, SVG is a potent and adaptable format. It is a popular option for designers and developers because of its scalability, accessibility, interactivity, short file size, and SEO-friendliness. SVG is a format that may assist you in producing visuals that look fantastic and work well on any platform, whether you're making icons, data visualizations, logos, or animations. But, it does have some restrictions that should be taken into account when selecting a format for a specific project.